This article appears in the Spring 2021 issue of MontessoriPublic — Print Edition.
Barriers to access remain— further study needed
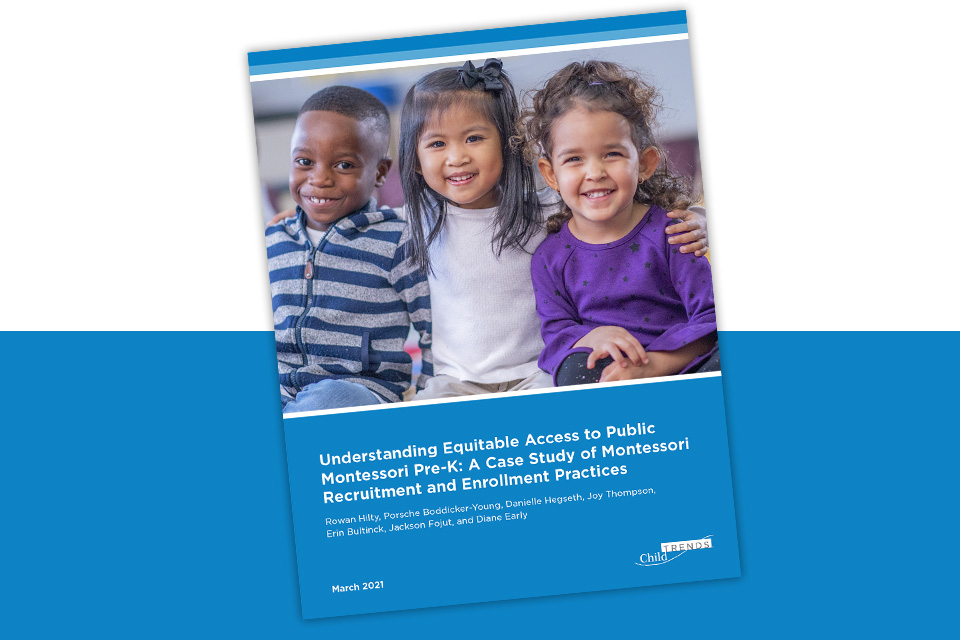
A new policy report from social research giant Child Trends (Understanding Equitable Access to Public Montessori Pre-K: A Case Study of Montessori Recruitment and Enrollment Practices) reviews the public Montessori early childhood education landscape and details how recruitment, enrollment, and location factors may limit equitable access.
The report is an outcome of the Brady Education Fund’s ongoing $3M research initiative, covered by MontessoriPublic in several articles, including Montessori equity research pivots to access in March, 2020. The initiative, originally intended to fund a substantial research project into the effectiveness of Montessori education across racial, cultural, and family income demographics, revised its goals when research teams found that when research teams found that the small pool of students in high-quality, true lottery Montessori schools wasn’t big enough to provide a racially diverse sample.
Instead, the project was split into three efforts, one of which was a grant to Child Trends to investigate the extent to which access to public Pre-K Montessori programs is equitable. This report is the result of that investigation.
The study aimed to examine equitable access to early childhood Montessori programs, as defined by the Office for Planning, Research, and Evaluation, a division of the federal department of Health and Human Services:
Access to early care and education means that parents, with reasonable effort and affordability, can enroll their child in an arrangement that supports the child’s development and meets the parents’ needs
The researchers developed three main questions. First, what does the landscape of public Montessori Pre-K look like? They undertook a landscape scan and data analysis to gather information and frame further questions.
Second, what are the programs’ recruitment and enrollment practices? How do families and children find and enroll in these programs, and how does that affect equitable access? Administrators from a subset of programs were interviewed on these and other program questions.
Finally, what were families’ perceptions off public Montessori Pre-K and other options? This was addressed with family interviews. However, recruitment was challenging, and only a small sample of families was interviewed.
Landscape scan
Using the NCMPS Montessori Census and data collected by the Trust for Learning as part of a 2018 Ideal Learning Landscape Study, researchers identified 288 public Montessori programs serving children four or younger. 82% of these also served three-year-olds, and most extended into elementary or even middle school. Overall, only a third of the schools were free for all children. Most were free (78%) or subsidized (5%) for kindergarten, but only a third were free for three- and four-year olds. About half (52%) used some form of lottery for enrollment, and another 23% were first-come, first-served. Only nine programs (3%) were “neighborhood schools.”
The researchers dove deeply into comparisons of student demographics and their surrounding regions. However, a number of factors complicated the analysis. Communities and schools were rated “Majority” Black, Hispanic/Latine, or White if they were over 50% in a category, which makes sense mathematically but can obscure some nuances of population distribution. The authors took care to note this limitation, and pointed out that other available metrics have limitations of their own. Schools and communities where no category was a majority were labeled “Diverse”.
Community demographics were taken from federal Census data, but school demographics were harder to gather and analyze. Schools don’t typically break out Pre-K-specific racial data, so the study used whole school data as a proxy for the Pre-K population. Some programs (at least 22%) were “school-within-a-school” models: Montessori programs embedded in a non-Montessori school, so their populations may also have been different.
Poverty level was analyzed by comparing schools’ overall Free and Reduced Price Lunch eligibility to Census data, although the authors noted recent research suggesting that this comparison may overstate poverty levels in schools.
Demographic match
Assembling these varied data sets, the researchers developed a matrix comparing schools’ racial demographics to their surrounding communities. With four demographic categories (Black, Hispanic/Latine, White, or Diverse) and two measurements (the school and the community), sixteen configurations were possible: Majority-White school in a Majority-White neighborhood, Majority-White in Majority-Black, and so on. In the actual counts, four main groups emerged:
Majority-White school in a Majority-White community — 45%
Majority White school in a Diverse community — 9%
Majority-Black school in a Majority-Black community — 17%
Diverse school in a Diverse community — 6%
Overall, 73% of schools have demographics that “match” their surrounding communities. Since most (63%) of the schools are in White communities, it’s possible, as the authors suggest, that this limits access to Black and Hispanic/Latine families, since fewer of them live in the neighborhoods with more schools, and the schools themselves are more likely to be Majority-White. But without knowing more detail about the neighborhoods and the schools it’s a little hard to tell. For example, given that 63% of schools are in White neighborhoods but only 45% are Majority-White, that might suggest better access, not worse.
In addition, there were no Majority-White schools in Majority-Black neighborhoods, which would have been a worrying suggestion of gentrification. 10 of 23 Majority-Black schools were in Majority-White neighborhoods, but again, that can be interpreted in various ways—is it a sign of diversity and equitable access for Black students within those majority white neighborhoods, or does it suggest that Black children have to go to a different neighborhood to be in a Montessori school?
Administrative survey
Additional data was collected through a survey of school leaders. Likely due to the pandemic, the response rate was lower than had been hoped—only 37 administrators responded. The authors are transparent about the limitations this created. (Demographic data for this subset were similar to that of the complete set of 288 schools.)
From the survey results, to the extent that conclusions can be drawn, it seems that
many programs had a bilingual teacher, but only a few had lead teachers covering the languages of all enrolled children
most programs offered transportation, but most Majority-White programs did not
most programs had easily accessible public transportation, except for Majority-White programs
Majority-White programs were more likely to charge at least some tuition
The most salient results from the survey were about enrollment policies. All programs were oversubscribed, and Majority-White programs had the shortest waiting list, suggesting high demand and limited supply in Black, Hispanic/Latine, and Diverse programs. Most used “some version of a lottery,” but “some version” covers a lot. Preferences for siblings and staff children were common, as they are in lottery programs generally. While these are understandable, it’s easy to see how they can perpetuate inequity when Majority-White programs are in Majority-White communities. Schools can often apply preferences for income, but less readily for race, so even schools that intentionally reach for diversity and equity may have a hard time doing so.
Family perceptions
Family perceptions about early childhood education options are vitally important, but unfortunately they were extremely hard to come by this year. In the end just 13 families were recruited, including 11 Montessori families and two from non-Montessori programs. Not much can be gleaned from so small a sample size, so if there were ever a rich opportunity for further exploration,
it is here.
Implications
The study faced significant limitations due largely, but not only, to the pandemic. March through May 2020 was not a great time to be contacting schools for information, and in fact the team stopped reaching out directly in mid-March. School administrators and families were likewise not readily available to take part in surveys and interviews. The low response rate to the administrative survey especially limits the conclusions which can be drawn.
In addition, data had to be drawn from a number of sources of varying quality and applicability. A 2016 record of the Montessori Census was used, (a current record of the Montessori Census may have yielded better data, and there is still need for investment and improvement in this important tool). Finally, the “demographic match” analysis had limitations the authors describe. That doesn’t mean the study has nothing to offer. As the authors state:
Importantly, this analysis was meant to serve as a preliminary exploration of the public Montessori pre-K programs nationwide, the children they serve, and the communities in which they are located. Although findings from the landscape scan should not be interpreted conclusively, we hope that our analysis and findings may still shed light on important trends regarding who has access to public Montessori pre-K and highlight future directions for research on this topic.
In the end, the study’s findings are unavoidably characterized by conditional language such as “may” and “might”. Still, if shedding light on trends and highlighting future directions for research was a goal, the study definitely succeeded.

David worked in private Montessori for more than twenty years as a parent, three-to-six year-old and adolescent teacher, administrator, writer, speaker, and advocate. In 2016 he began working with the National Center for Montessori in the Public Sector. David lives in Portland, Oregon.
You may also like