Research backs the Montessori 3-year cycle
By Sonya Hemmen, Ryan Marks, and Katie Brown
Data analysis shows measurable growth in the third year
In 2018, NCMPS analyzed assessment data from 43 public and private Montessori schools using Measures of Academic Progress (MAP), an assessment tool developed by the Northwest Evaluation Association (NWEA). This analysis found that students in Montessori schools performed better on MAP in reading and math, and that student growth accelerated as students neared the end of upper elementary (sixth grade). In this article, we relate how Ross Montessori, a charter school in Colorado, collaborated with their authorizer to use MAP data to show how its students benefited from the full three-year cycle called for by the Montessori approach.
MAP at Ross
In 2005, when Ross Montessori School received approval for its first charter contract from the Charter School Institute, founding staff and board members chose MAP as its interim assessment program for math, reading, language, and science. It has remained a durable and dependable interim assessment since then and provides the school’s educational team with individualized data that helps them to personalize instruction for their students.
MAP is used across many educational approaches in conventional public, charter, and independent schools, and the information provided guides educators to customize the learning lessons for students as individuals, in small and large groups. The tool provides teachers with detailed information about what students can do in K–12 math, reading, language usage, and science, along with accurate, actionable evidence to help inform instructional strategies regardless of how far students are above or below grade level. It also connects to a large set of instructional content providers, giving educators flexibility in curriculum choices.
One day, Head of School Sonya Hemmen was approached by a parent of a fourth grade student. This parent loved the school and the Montessori model, but was struggling to interpret and understand their student’s interim assessment data, which showed the student at or below the national norm. Hemmen was able to articulate how the three-year cycle would result in a student who, at the end of sixth grade, would be able to demonstrate increased growth and achievement, and how in the meantime, it was perfectly normal to see achievement and growth that was below norms. The school had fielded similar questions over the years, and was interested in broadening its response to this question to not only include an explanation of the Montessori model, but also include empirical evidence showing the impact that the three-year cycle has on student achievement and growth using the schools interim assessment data. So, Hemmen approached her school’s authorizer, the Colorado Charter School Institute (CSI), for help with providing some more empirical evidence to their families about student learning trajectories under the Montessori model.
A collaborative approach to accountability
CSI is a statewide charter public school authorizer committed to creating and sustaining a portfolio of high-quality school options that meet the needs of all students. CSI authorizes over 40 schools across Colorado, from Towaoc to Steamboat Springs and Grand Junction to Colorado Springs, serving over 22,000 PK-12 students. These schools offer over sixteen unique educational models—including Early College, Alternative Education Campus, Waldorf, Classical, and Montessori—to best meet the needs of their communities.
As an authorizer, CSI offers support, flexibility, and transparent accountability to ensure its schools are in the best position possible to serve their students. CSI’s focus on outcomes rather than processes allows the institute to be neutral on educational model and maintain a diverse portfolio of school models.
In order to sustain the diversity of the existing portfolio and encourage new and innovative charter school models, CSI has undertaken a multi-year effort to update and evolve its accountability system and practices to identify different yet still rigorous ways of evaluating school quality and support continuous improvement. While there is a strong and comprehensive accountability system at CSI, it is essential to innovate and make sure that there is consistent and meaningful accountability for all schools as they implement their educational models. This query from Hemmen provided an opportunity to explore new approaches to evaluating school quality.
Methods
Achievement and growth MAP data in English Language Arts and Math was collected for all students for the past five years. Achievement is a measure of what a student knows and growth measures student progress from one test to another. This study used the NWEA RIT scale to measure achievement and the conditional growth percentile to measure student progress against their individualized growth goals. Five-year cohorts were created for groups of students who had been enrolled at the school continuously over those five years and had interim assessment results in the spring for all years examined. In the end, three cohorts were created and evaluated (6th, 7th, and 8th grade cohorts). For this article, we will highlight the 8th grade cohort.
Results—Achievement
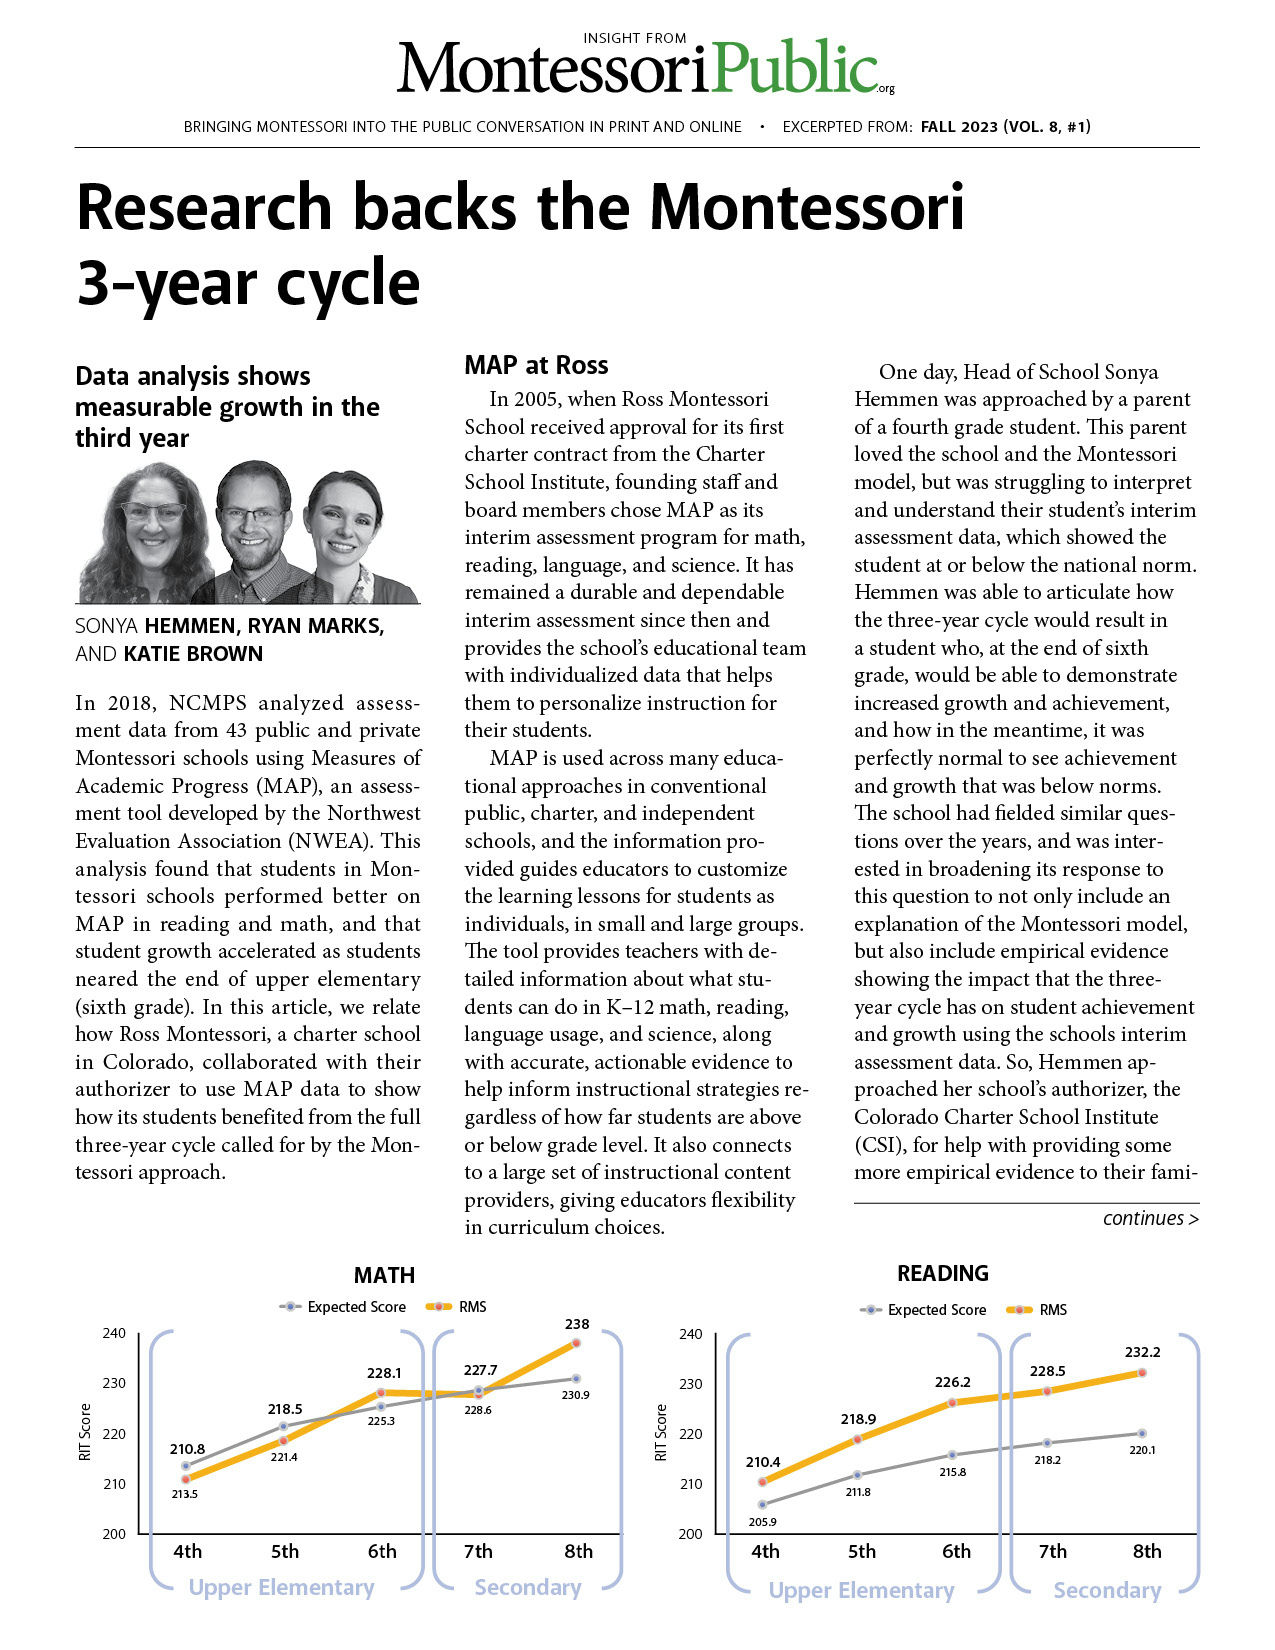
First, using the five-year cohort, we looked to see if the three-year cycle was visible in student achievement scores. During the upper elementary three-year cycle, the cohort began below the norm in math in 4th grade, but exceeded the norm at the end of the cycle. The cohort saw an increase of 7.7 points from 4th to 5th grade (compared to the expected 7.9 points). However, from 5th to 6th grade, the cohort saw an increase of 9.6 points (compared to the expected 3.9 points) and exceeded the norm in 6th grade.
During the secondary years, the cohort began at the norm in math and again exceeded the norm at the end of the cycle. The cohort maintained the score during the transition from the Upper Elementary cycle to the Secondary cycle (228.1 in 6th grade to 227.7 in 7th grade) and was at the norm in 7th grade. The cohort then saw an increase of 10.3 points from 7th to 8th grade (compared to the expected 2.3 points).
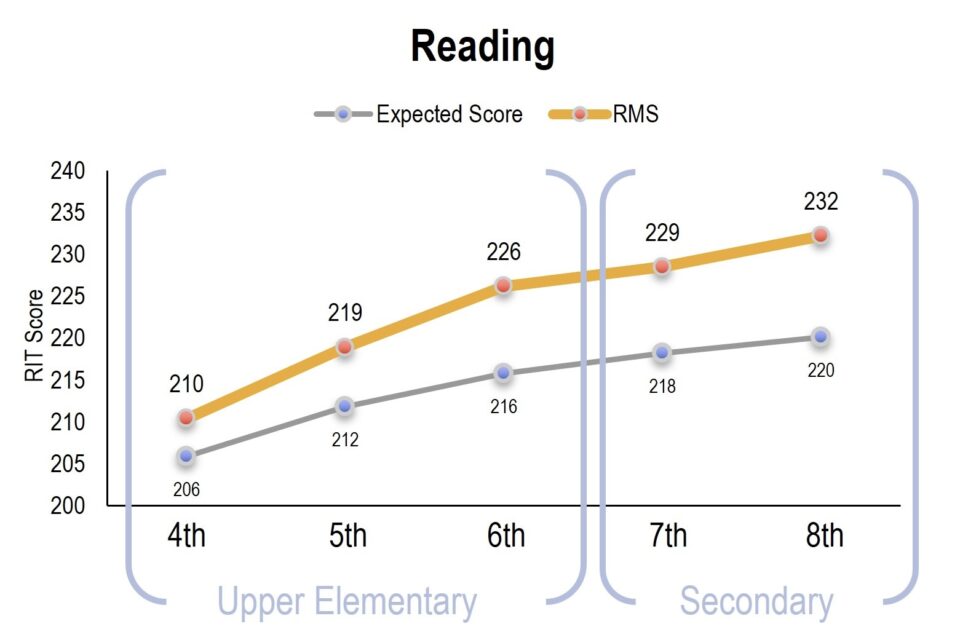
Similar patterns were observed in reading; however, the cohort always remained above the norm. The cohort saw an increase in the score of 8.5 points from 4th to 5th grade (compared to the expected 5.9 points) and an increase of 7.3 points from 5th to 6th grade (compared to the expected 4.0 points). During the secondary three-year cycle, similar patterns were observed, and the cohort continued to exceed the norm despite a smaller change in score during the transition from 6th to 7th grade. The cohort saw a 2.3 point change during the transition from upper elementary to Secondary that was similar to the expected change (2.4 point expected change), and an increase of 3.7 points from 7th to 8th grade (compared to the expected 1.9 points).
Results—Growth
Using the five-year cohort, we looked to see if the three-year cycle was visible in student growth scores. In math, during the upper elementary three-year cycle, the percentage of students exceeding their conditional growth percentile increased each year from 10% in 4th grade at the start of the cycle to 70% in 6th grade at the end of the cycle. During the transition from upper elementary to secondary, the percentage of students exceeding their conditional growth percentile dropped from 70% in 6th grade to 30% in 7th grade in math. However, during the 8th grade year, 70% of students in the cohort were again exceeding their conditional growth percentile.
In reading, during the upper elementary three-year cycle, the percentage of students exceeding their conditional growth percentile increased from 50% in 4th grade at the start of the cycle to 60% in 6th grade at the end of the cycle. There was not as clear of a pattern in reading as in math and there was a decrease in the percent of students exceeding their individualized growth goal in 5th grade. During the transition from upper elementary to secondary, the percentage of students exceeding their conditional growth percentile dropped from 60% in 6th grade to 50% in 7th grade. However, during the 8th grade year, 80% of students in the cohort were again exceeding their conditional growth percentile.
Additional cohort groups (7th grade and 6th grade) were included in the analysis and while the patterns in the additional cohorts are not as visible as the 8th grade cohort, there is an indication that the three-year cycle has an influence on achievement and growth patterns for all three cohort groups.
Implications
These data demonstrate that Montessori instruction is effective, with the biggest payoff coming at the end of each level. Montessori is traditionally offered in a three-year cycle starting with the youngest learners. In the case of Ross Montessori, levels are K, grades 1-3, grades 4-6, and grades 7-8. Parents had been observing that their child’s achievement may have been high, but that their achievement did not seem to keep up at the same pace. As the three-year cycle unfolds, the longitudinal data from students shows that comparatively, students perform less well in the first year of the cycle, improve= in year two and demonstrate significant growth in the final year of any level of instruction. Ross uses the data collected from MAP and shares it with parents to illustrate that when students remain at Ross for all levels of Montessori instruction, their learning and achievement places them solidly in a strong place for high school and beyond.
Though the adolescent program is not a complete three-year cycle, serving only grades 7 and 8, MAP test results follow the same pattern: achievement and growth are both higher in eighth grade than in seventh. Hemmen commented that students who have completed middle school are successful at local high schools and continue on into public and private colleges and universities, as well as into trades positions. She adds that, “The Montessori Method follows the child as Dr. Montessori advised. Montessori alumni have great track records for following their passions. MAP would capture this if local secondary schools assessed students with it and we are certain that Ross student tests in PSAT show their individual achievement and curricular gains.”
Though many students in public Montessori schools leave after fifth grade to matriculate into a traditional middle school, MAP scores from Ross suggest that the sixth grade year is an important year of learning and consolidation. These results are consistent with NCMPS’s nationwide analysis five years ago. Additionally, this collaboration between Ross and CSI demonstrates how Montessori charter schools and their authorizers can work together to develop assessment and accountability frameworks that hold Montessori schools accountable for student learning while also upholding the integrity of the Montessori model.

Sonya Hemmen, Ryan Marks, and Katie Brown
Sonya Hemmen is Head of School at Ross Montessori School in Carbondale, CO.
Ryan Marks is the Chief of Authorizing and Accountability at the Colorado Charter School Institute.
Katie Brown is the Director of Research for the National Center for Montessori in the Public Sector.
You may also like